Social Security Visualizer
Fast, Easy Scenario Analysis for Retirement Benefits
The Social Security Visualizer gives advisors and tax professionals a fast, intuitive way to compare retirement benefit outcomes. It highlights how claiming decisions and household longevity shape long‑term income, making it easier to guide clients through complex choices. With simple inputs and clear visuals, it turns Social Security planning into a confident, client‑ready conversation.
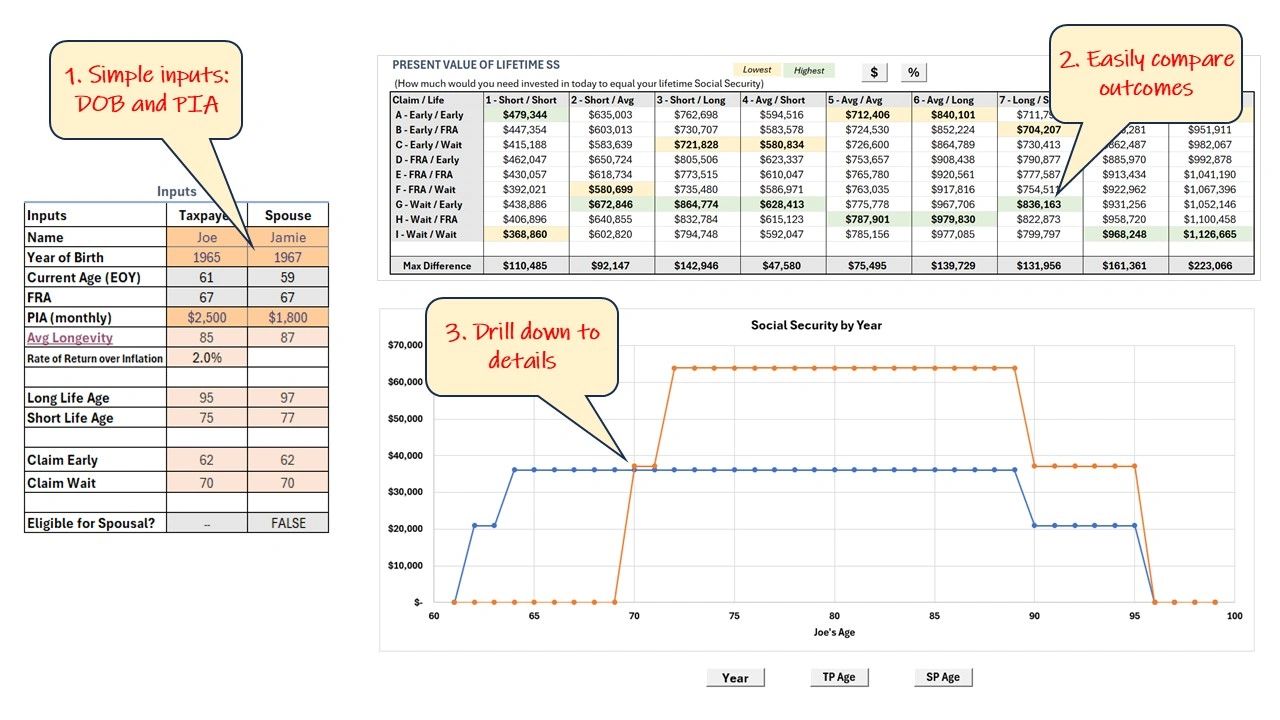
The Visualizer models personal, spousal, and survivor benefits across a full grid of claiming‑age combinations. The 9×9 scenario matrix highlights the most favorable outcomes, while the drill‑down view shows the year‑by‑year benefit stream for any scenario. Everything is built in Excel, giving you a familiar interface, straightforward navigation, and clear outputs ready for client conversations.
From Inputs to Insights